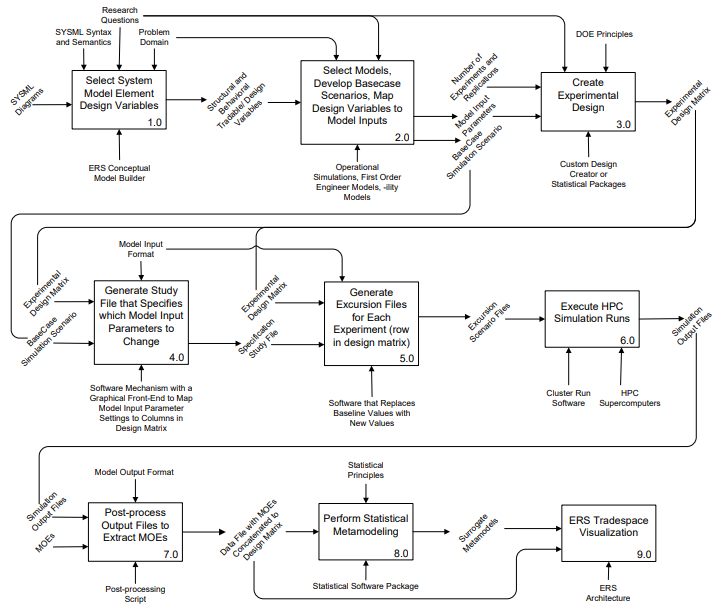
System Engineers rely on a variety of models to help understand different viewpoints in several domains throughout a system's life-cycle. These domain models include operational simulations, life-cycle cost models, physics-based computational models, and many more. Currently, there is a technical gap regarding our ability to untangle the system design drivers within these system life-cycle domains. I conducted a reimbursable research project to address this challenge by leveraging the genetic algorithm I developed during my PhD dissertation to generate the experimental designs needed to explore complex multi-dimensional simulations output landscapes. I proposed a procedural workflow that addresses the technical gap by leveraging the methods of experimental design in order to clearly identify tradable variables and narrow the search for viable system variants. The following diagram outlines the workflow.
To illuminate the tradeoffs that exist in a complex system design problem I proposed an approach that approximates model input and output behavior using the functional form of statistical metamodels. The purpose is to illuminate trade decisions across several different viewpoints by integrating metamodels that approximate the behavior of multiple domain models. My research supported the tradespace analytics pillar for the development of the Engineered Resilient System (ERS) Architecture. ERS is a Department of Defense initiative developed by the US Army Engineered Research Development Center. The purpose of ERS is to leverage information technology to create a digital thread of architectural decisions accessible to multiple communities of interest to inform better manufacturing options during a system’s life-cycle.
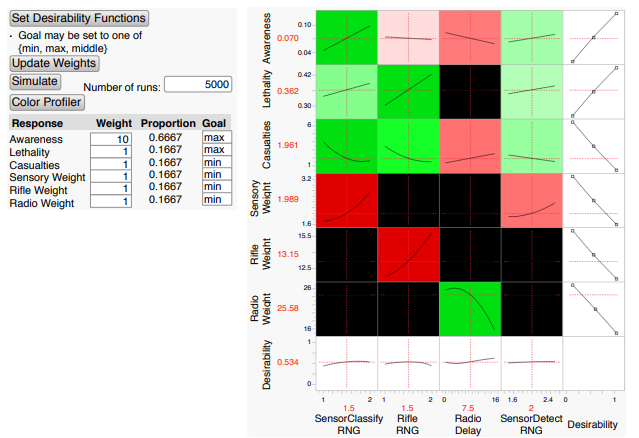
To represent the complex behaviors of various simulation models, I explored various machine learning methods including stepwise regression, neural nets, boosted trees, and boot strapped forests. My team and I developed a dashboard to help illuminate the key tradable variables across multiple model inputs and outputs.
The dashboard below contains a color-coded grid. The row and column with white backgrounds relate to desirability functions that indicate the desired direction of improvement for an output. Each of the other columns represents a model input and each of the other rows represents a model’s output. Every other cell in the grid shows a cross section of the row’s output as the input changes, holding all other inputs at designated levels. Two key features of the dashboard are: (i) it identifies tradable input variables with a color profiler algorithm, and (ii) it optimizes solutions to find input settings that perform well across multiple model outputs.